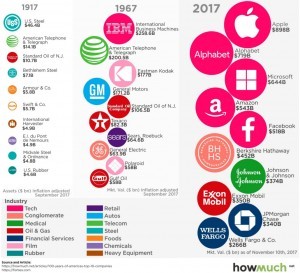
Infographic: The Most Valuable Companies in America Over 100 Years
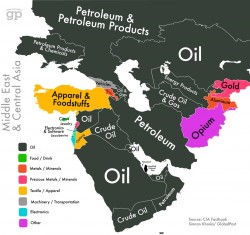
This One Map Sums Up the Economy of the Middle East
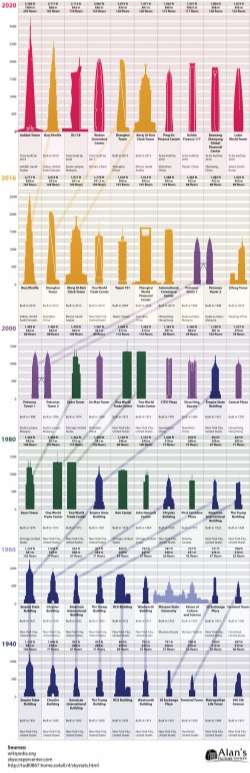
A Changing Skyline: The World’s Tallest Buildings Over Time

The Evolution of Battery Technology
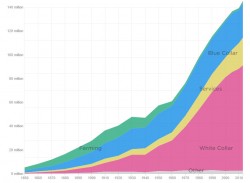
How Machines Destroy and Create Jobs
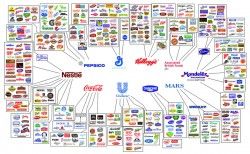
The Illusion of Choice in Consumer Brands

Then and Now: Key Bitcoin Stats and Figures

U.S. Healthcare is a Global Outlier, and Not in a Good Way
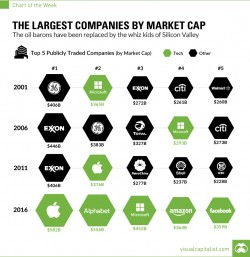
Chart: The Largest Companies by Market Cap Over 15 Years
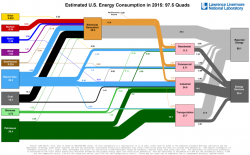
See All U.S. Energy Consumption in One Giant Flow Diagram
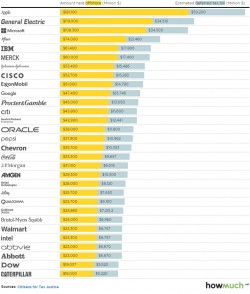
Fortune 500 Companies with the Most Cash in Offshore Tax Havens
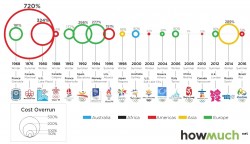
Rio Games a Success at Finishing ‘Only’ 51% Overbudget
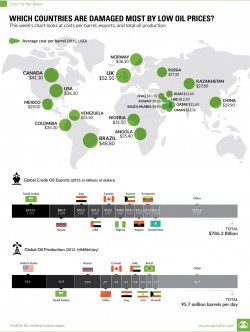
Chart: Which Countries Are Damaged Most by Low Oil Prices?
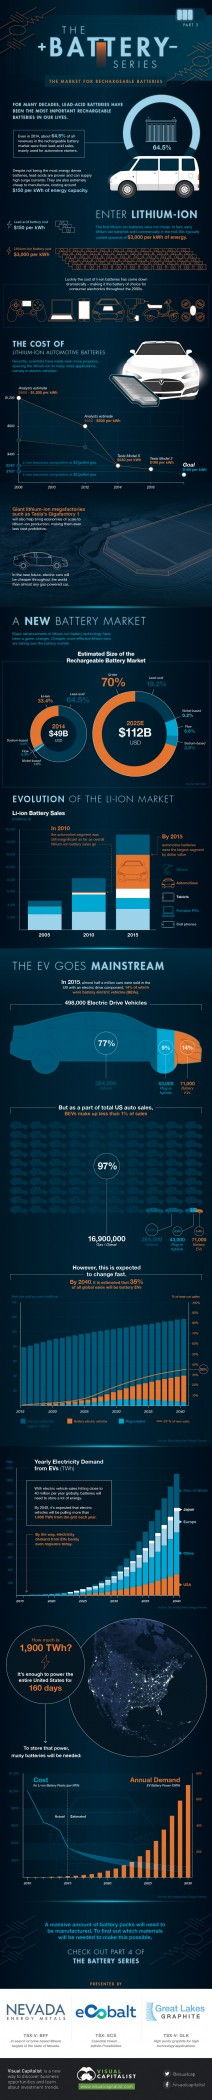
Infographic: Explaining the Surging Demand for Lithium-Ion Batteries

Infographic: The Evolution of Virtual Reality

The Five Tallest Glass Skyscrapers, and the Views From Their Tops
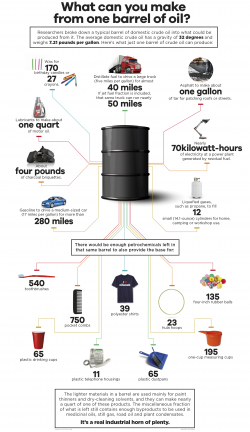
Infographic: What Can Be Made from One Barrel of Oil?

Infographic: How the World’s Most Iconic Logos Evolve Over Time
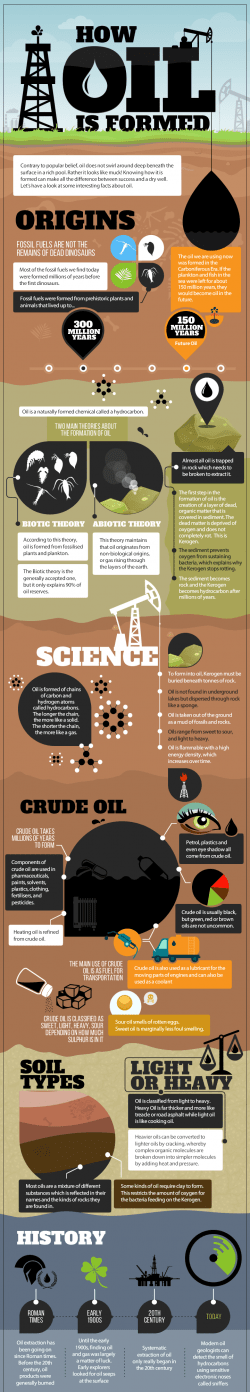
Infographic: How Oil is Formed
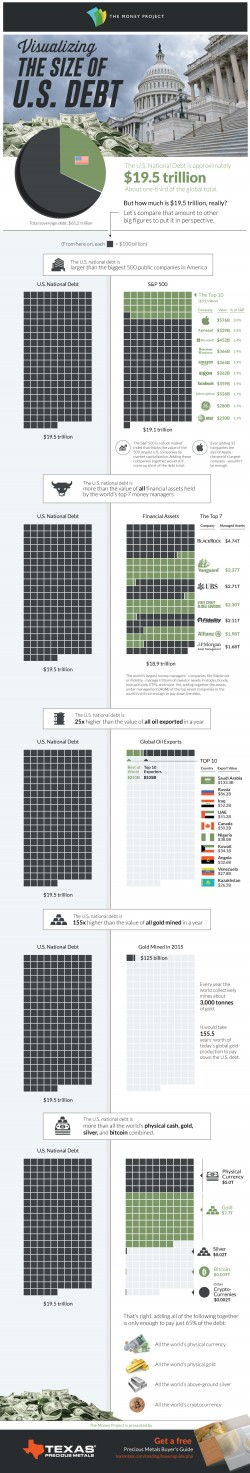
Infographic: Visualizing the Size of the U.S. National Debt
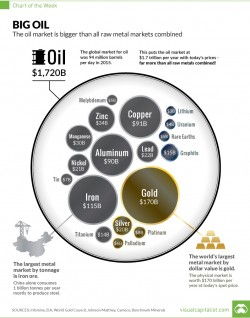
The Oil Market is Bigger Than All Metal Markets Combined
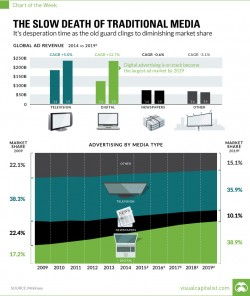
Chart: The Slow Death of Traditional Media
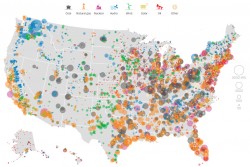
Mapping Every Power Plant in the United States – Visual Capitalist