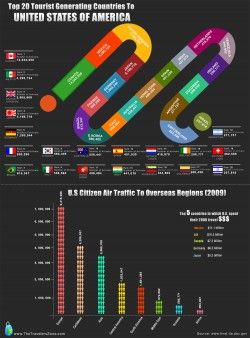
Top 20 Tourist Generating Countries to the US : 2009

Visualizing The U.S. Electric Grid
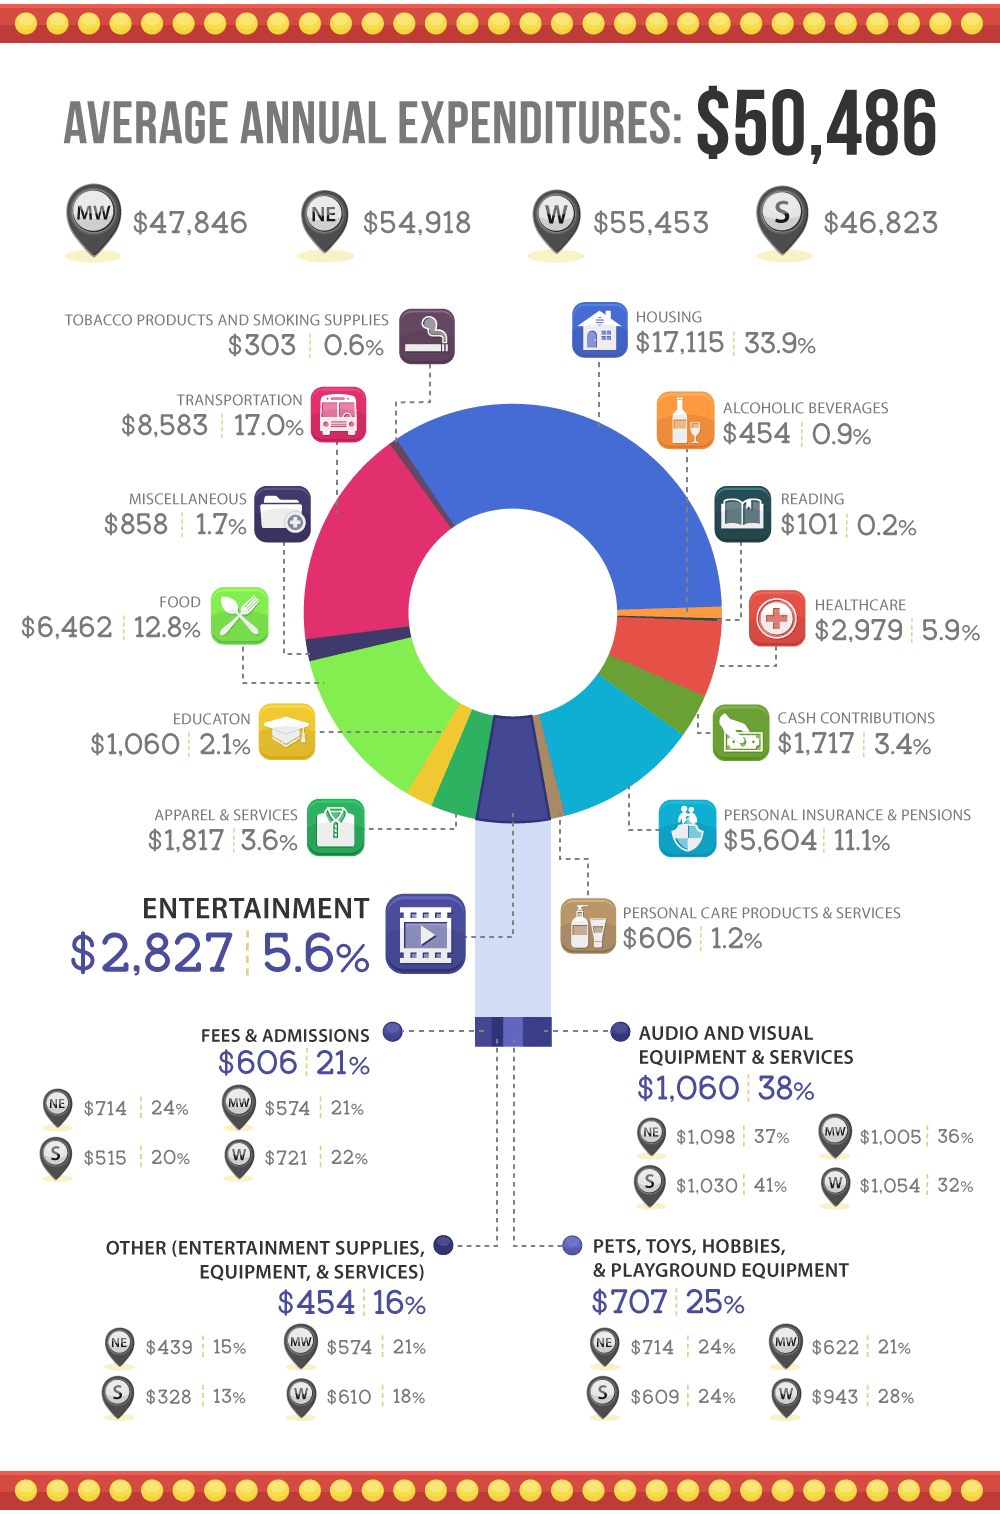
how Americans are spending their money
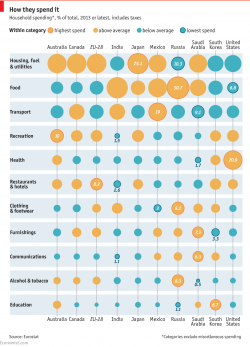
Daily chart: How countries spend their money | The Economist
![Where Does the Money Go? [Infographic]](https://cdn.designblognews.com/wp-content/uploads/2016/11/where-does-the-money-go-infographic-infographic-data-visualization-encyclopedia-information-techno-1478671646g8nk4-250x191.jpg)
Where Does the Money Go? [Infographic]
![Leading Causes of Death [Infographic]](https://cdn.designblognews.com/wp-content/uploads/2016/11/leading-causes-of-death-infographic-infographic-data-visualization-encyclopedia-information-techno-1478671457ng4k8-250x195.jpg)
Leading Causes of Death [Infographic]

Aircraft Carrier Silhouettes Free Vector Pack
Aircraft Carrier Free Vector Pack
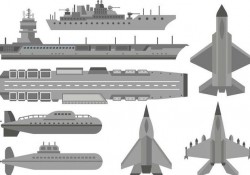
Free Military Aircraft Carrier Vector
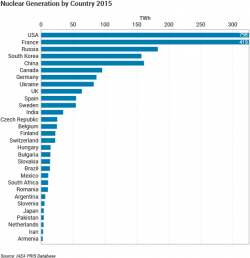
Nuclear Power Today | Nuclear Energy
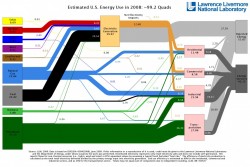
U.S. Energy Use Drops in 2008 Infographic

Free Silhouette Aircraft Carrier And Jet Aircraft Vector

Made in France – raconteur.net
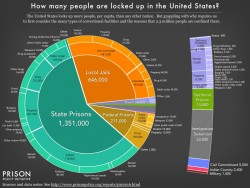
This Eye-Opening Prison Population Pie Chart Will Blow Your Mind | EverythingAboutDesign.com
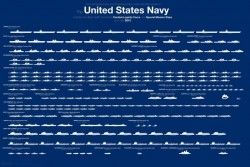
Here?s the Entire U.S. Navy Fleet in One Chart
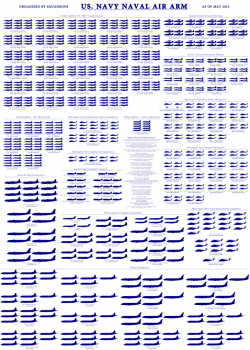
US. Navy Naval Air Arm
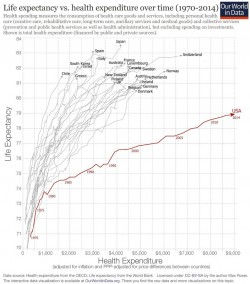
U.S. Healthcare is a Global Outlier, and Not in a Good Way
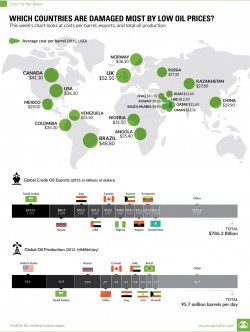
Chart: Which Countries Are Damaged Most by Low Oil Prices?

The Five Tallest Glass Skyscrapers, and the Views From Their Tops
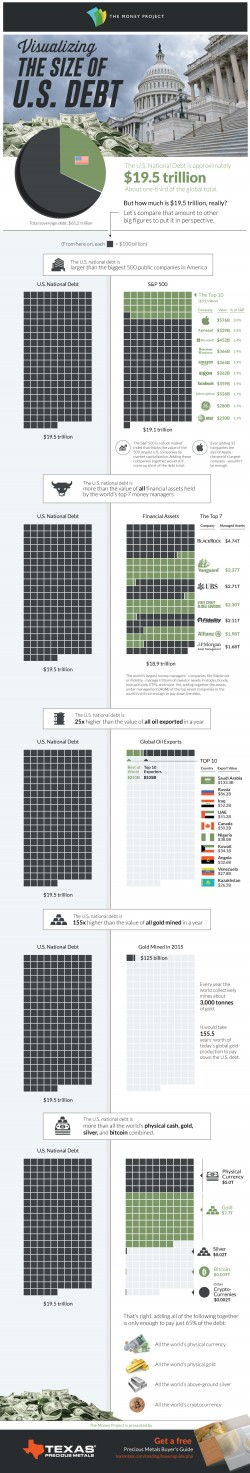
Infographic: Visualizing the Size of the U.S. National Debt
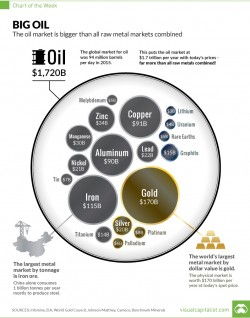
The Oil Market is Bigger Than All Metal Markets Combined
Graph of the Day: Watch US electricity grid evolve before your eyes : Renew Economy
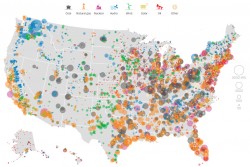
Mapping Every Power Plant in the United States – Visual Capitalist
![How Men Dominate The U.S. Media Landscape [Infographic]](https://cdn.designblognews.com/wp-content/uploads/2016/11/how-men-dominate-the-us-media-landscape-infographic-14783522464kn8g-250x178.jpg)
How Men Dominate The U.S. Media Landscape [Infographic]